Squirrel's Tech Radar
Tech Assets Radar Chart
You can use the Tech Assets Radar Chart to quickly assess your tech organisation. I developed this method after evalauting hundreds of organisations through my health checks and transformation projects.
There's no need to delve into code or decipher architecture diagrams to get an overall picture of your engineering health. (Does your doctor do a CAT scan at your annual checkup? This is the equivalent of a stethoscope.)
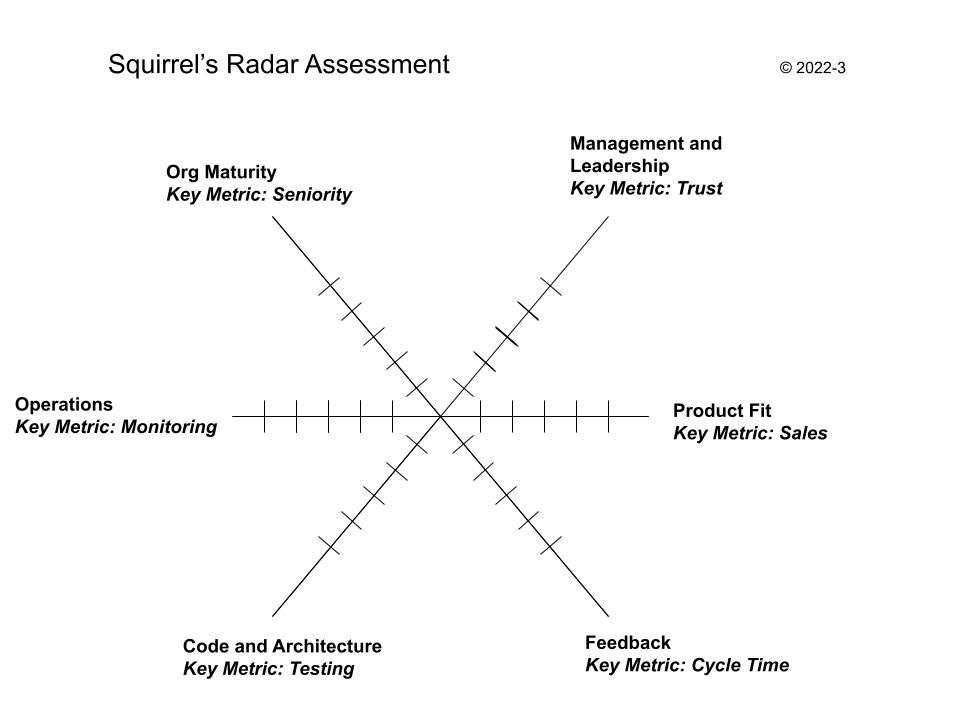
There are six axes on which to measure, each with a "key metric" that you can measure quickly to tell you, like a canary in a coal mine, whether your team is being starved of oxygen. Each key metric is described in a little more detail below. You should be able to get a reading on each one without any investigation or detailed analysis—all you need is to pay attention to how your tech team works and what its results are. A pro tip: get tech and non-tech people together to assess each item with your help, as each group will bring a helpful persepective.
- Seniority. What is your ratio of senior to junior staff in the tech team, and is it right for you?
- Trust. Are your tech team executives respected and listened to by their staff and peers? Are they aligned clearly to company goals?
- Sales. Do your products solve expensive problems for customers that they are willing to pay for?
- Cycle Time. What is the time between committing to a change and measuring the value of that change with real customers?
- Testing. How confident are you that a change you make will leave the system operating correctly?
- Monitoring. How confident are you that the system will work correctly throughout its hours of operation?
I'd love to hear from you as you apply the radar, and to answer questions about how it works. Give me a ring anytime on the Squirrel-Phone (number in the heading above), or drop me a line at ds@douglassquirrel.com .